

Fishbone Diagram Root Cause Analysis: 6 Powerful GMP Steps for 2026

Fishbone diagram root cause analysis helps pharmaceutical investigation teams organize potential causes of GMP deviations without mistaking brainstorming for proof. The six-category Ishikawa model can expose failures involving methods, machines, materials, personnel, measurement and environment. FDA 21 CFR 211.192 requires investigation of unexplained discrepancies and failures, including related batches. ICH Q10 connects investigations to CAPA.

In pharma quality management, the diagram becomes useful only when each branch connects to traceable evidence. EU GMP Chapter 8, sections 8.16–8.19, emphasizes proportionate investigation, careful treatment of human-error conclusions, CAPA effectiveness and recurring-defect trends. Teams should document disconfirming evidence before proposing controls

Table of Contents

Fishbone Diagram Root Cause Analysis: GMP Foundations

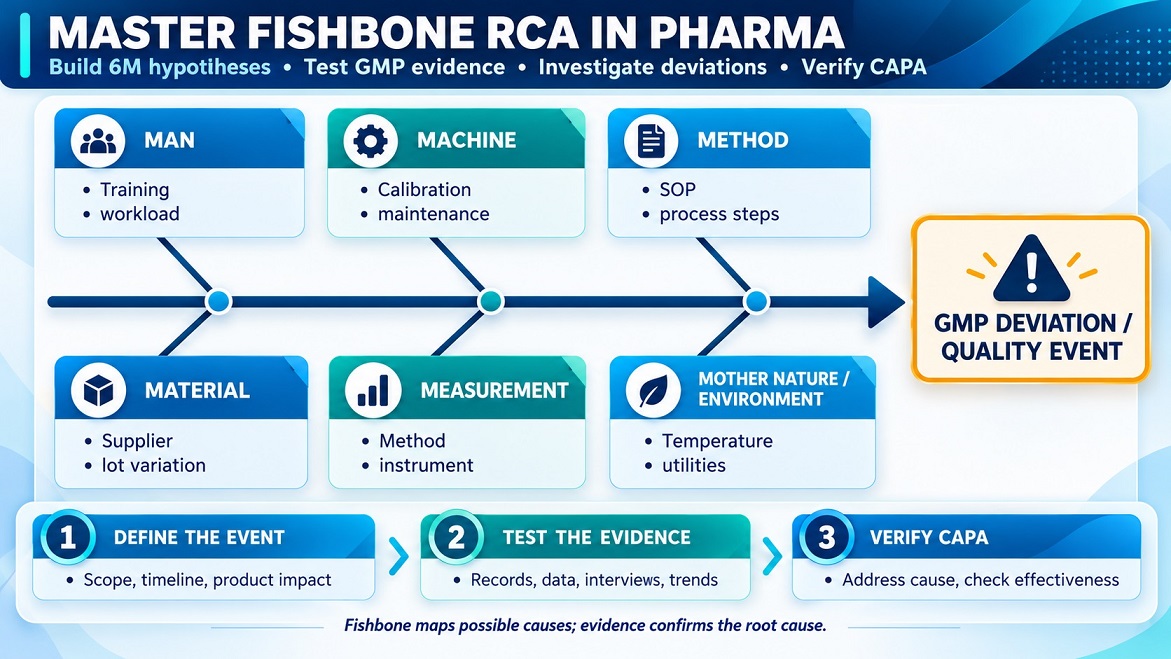
A fishbone, or Ishikawa cause-and-effect diagram, groups plausible contributors around one clearly defined effect. ASQ includes it among the seven basic quality tools. In GMP operations, it supports cross-functional hypothesis mapping; causal confirmation still depends on reliable records, scientific reasoning, and appropriately designed tests. A diagram alone cannot establish product disposition.

6M fishbone workflow

What Makes a Defensible Problem Statement?

Describe the affected process, measurable signal, batch population, time interval and approved acceptance criteria. “Dissolution was poor” is too vague; “three of twelve monitored batches showed a downward dissolution trend after a recipe revision” is testable. This 3/12 ratio, or 25%, is an illustrative scenario—not an industry failure rate.

From Weak Statements to Inspection-Ready Evidence

Design element Weak statement Inspection-ready evidence
Observed event
Failure occurred
Specific OOT/OOS/deviation
Population
Several batches
List of lot numbers and period
Expectation
Process should work
SOP limit and specification
Impact
Low risk assumed
Documented patient/product risk
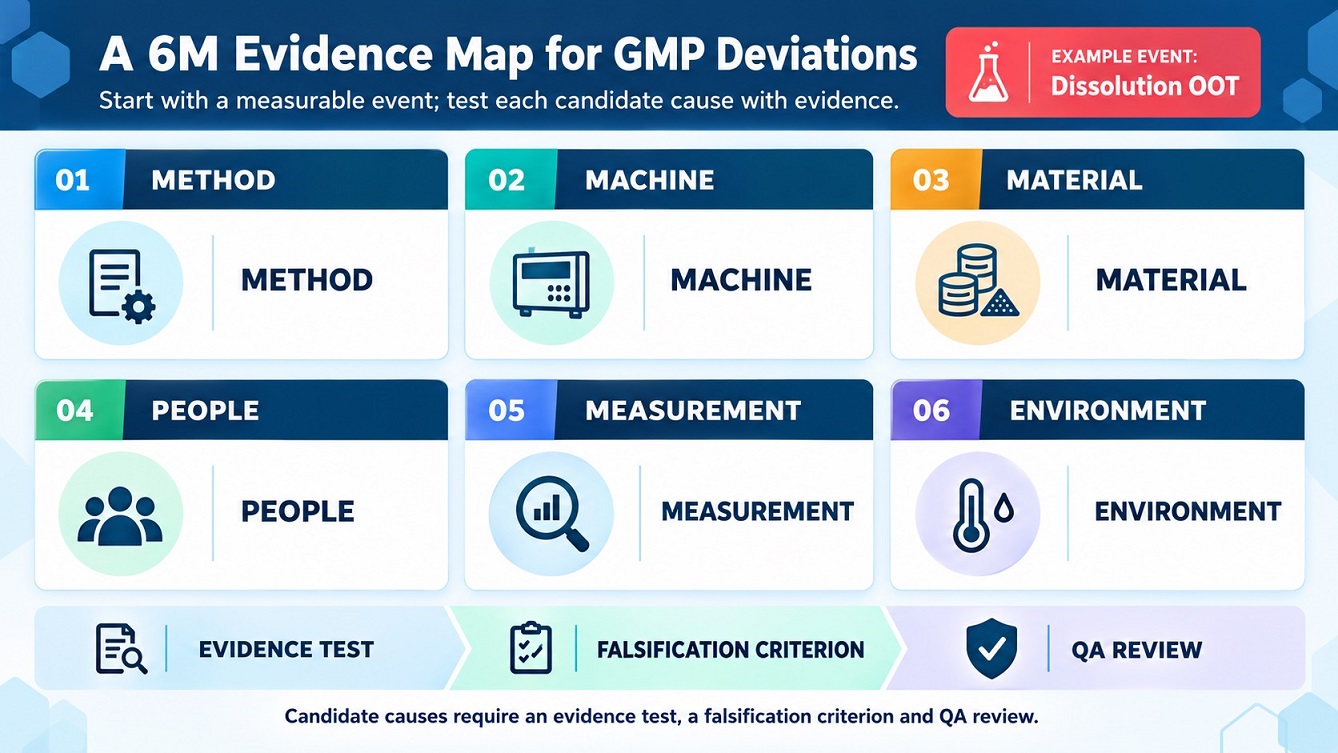
se the six 6M categories to organize possible causes of a GMP deviation. Test each hypothesis against evidence, define how it could be disproved, and include QA review.
A 6M Evidence Map for GMP Deviations

6M Method for Fishbone Diagram Root Cause Analysis

Use the 6M taxonomy as a starting framework. A fishbone branch names a possible contributing factor, not a verified root cause:

  • Methods and procedures
  • Machines and equipment
  • Materials and components
  • Manpower and human factors
  • Measurement and analytical systems
  • Milieu (environment) and utilities

First M , Methods: Control the Process Logic

Investigate process instructions, approved recipes, sequence constraints and change controls. An unclear mixing endpoint may permit variable execution even when operators complete training. Compare authorized versions, actual event timestamps and process validation data before deciding whether the method explains the observed deviation.

Second M , Machines: Examine Equipment Performance

Check whether assets operated within the qualified state and approved control strategy. Review equipment event logs, interlocks, preventive maintenance and calibration history. Distinguish a failed instrument from a genuine manufacturing parameter excursion.

  • Review alarm chronology
  • Confirm qualification status

Third M , Materials: Investigate Lot-to-Lot Variation

Compare supplier lots, critical material attributes, receipt conditions and sampling outcomes. A viscosity shift can affect granulation behavior, but coincidence does not prove causation. Stratify affected and unaffected batches and check whether raw-material trends track the failure onset.

Forth M , Men: Test Human-Factor Hypotheses

Do not close the investigation with “operator error” alone. Ask whether workload, instructions, interfaces and supervisory checks made the error likely or undetectable. EU GMP Chapter 8 cautions against missing process or system causes when human error is implicated.

  • Assess task qualification
  • Examine shift handovers

The Last One , Environment: Examine Utilities and Conditions

Review temperature, humidity, differential pressure, HVAC intervention, cleanroom environmental monitoring and utilities. Identify whether a deviation aligns temporally with a credible exposure pathway rather than a coincidental alert.

  • Compare environmental trends
  • Review intervention records

A practical categorization decision must consider the mechanism of failure, not merely the department reporting it. For example, an HPLC integration issue could belong to Measurement if the analytical processing rule is faulty, but to Method if the approved integration SOP is ambiguous. Duplicate hypotheses should be merged without deleting the supporting observations. The facilitator should mark each cause as proposed, under test, supported, excluded or inconclusive, with a named evidence owner.

How to Build and Verify a Fishbone

Place a measurable effect at the head of the diagram. Invite manufacturing, QC, QA, engineering and validation experts to populate the six branches. Consolidate duplicates, separate immediate events from systemic contributors and select evidence tests proportionate to risk. Record negative findings so discarded hypotheses remain traceable. Define impacted lots and interim controls before completing causal work.

Evidence collection should be designed before teams become attached to one preferred explanation. Compare affected and unaffected batches, identify potential confounders and verify whether data were recorded contemporaneously. Where trend evidence is weak, consider a controlled trial under an approved protocol, provided the proposed test does not create unjustified patient or product risk. A useful working table links every fishbone branch to the hypothesis, required source record, anticipated observation, contrary observation and final decision. QA should challenge unsupported causal language and review the scope of associated products.

Pharmaceutical Fishbone Example: Aseptic EM Alert

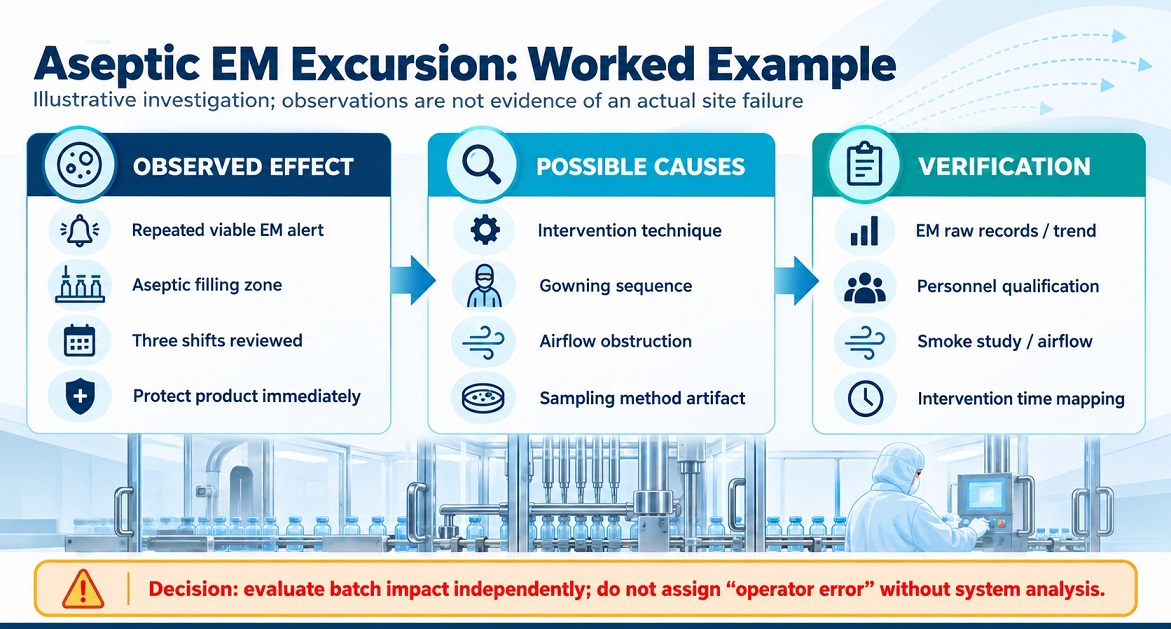
Consider a fictional aseptic filling line with repeated viable environmental monitoring alerts. Potential branches include airflow obstruction, gowning practices, interventions, cleaning execution, sampling technique and HVAC performance. Product impact requires its own evaluation; an attractive fishbone diagram does not establish sterility assurance or automatically justify batch release.

A first-pass fishbone may overemphasize environmental readings because they are easy to visualize. However, microbial recovery can also be influenced by sampling location, agar exposure duration, handling, personnel movement and intervention sequence. Investigators should examine the control strategy and qualification basis rather than simply counting branch entries. For aseptic manufacturing, relate findings to contamination-control strategy, applicable EU GMP Annex 1 requirements and the site’s approved environmental monitoring program. Escalation and initial batch protection must not wait for the diagram to be completed.

Aseptic EM Excursion: Worked Example

Which Data Could Confirm the Mechanism?

Investigators align viable and nonviable monitoring trends with batch and intervention chronology. They examine airflow visualization, personnel qualification, equipment alarms, cleaning records and laboratory controls. A cause moves from possible to supported only when evidence consistently fits the proposed mechanism and competing explanations have been reasonably addressed.

Inspection Risks and Common Fishbone Mistakes

Inspection challenges arise when a site treats ideas as conclusions, blames an individual without studying system design, ignores repeated deviations, or closes CAPA on attendance records alone. FDA 21 CFR 211.192 expects written conclusions and follow-up, with investigation of associated batches and products. Investigators should show why each material hypothesis was supported, excluded or left unresolved.

Final Word

A defensible fishbone diagram root cause analysis connects a precise quality problem to a structured set of plausible mechanisms, then tests those mechanisms against contemporaneous GMP evidence. Use cross-functional review, independent product-risk decisions and risk-based CAPA. The result should be a clear, reproducible investigation—not a visually impressive chart with unsupported conclusions.

FAQs

1️⃣ What is a fishbone diagram in pharmaceutical root cause analysis?


A fishbone diagram, also called an Ishikawa diagram, organizes possible causes of a defined quality problem. It helps teams develop and review hypotheses; it does not prove the root cause.

2️⃣ What are the six fishbone categories used in pharmaceutical investigations?


The 6M categories are Methods, Machines, Materials, Manpower, Measurement, and Milieu (environment and utilities). Teams can use them as a starting framework and adapt them to the event.

3️⃣ What makes a GMP problem statement inspection-ready?


What makes a GMP problem statement inspection-ready?

Picture of Ershad Moradi

Ershad Moradi

Ershad Moradi, a Content Marketing Specialist at Zamann Pharma Support, brings 6 years of experience in the pharmaceutical industry. Specializing in pharmaceutical and medical technologies, Ershad is currently focused on expanding his knowledge in marketing and improving communication in the field. Outside of work, Ershad enjoys reading and attending industry related networks to stay up-to-date on the latest advancements. With a passion for continuous learning and growth, Ershad is always looking for new opportunities to enhance his skills and contribute to pharmaceutical industry. Connect with Ershad on Facebook for more information.

Fishbone Diagram Root Cause Analysis: 6 Powerful GMP Steps for 2026

Build 6M Ishikawa diagrams to explore potential causes across Man, Machine, Method, Material, Measurement, and Mother Nature (Environment). Test each cause against documented GMP evidence, investigate deviations systematically, and distinguish confirmed root causes from assumptions. Then define CAPA that addresses the cause and verify its effectiveness to help prevent recurrence.

Read More »

Share