


Root cause analysis in pharmaceutical industry investigations identifies the mechanisms behind deviations, laboratory failures and recurring process defects. Under 21 CFR 211.192, unexplained discrepancies require thorough investigation; ICH Q10 section 3.2.2 expects structured, risk-proportionate investigations. RCA separates the observed event from a defensible causal conclusion and records supporting evidence.
For stronger pharma quality management, investigators should connect batch records, equipment histories, analytical data and process controls before selecting corrective actions. EU GMP Chapter 8, sections 8.16–8.19, addresses RCA, human-error justification, CAPA effectiveness and defect trending. The goal is sustainable control and patient protection.
Table of Contents
What Is Root Cause Analysis in Pharmaceutical Industry?
An RCA is a documented, hypothesis-driven examination of why a quality event occurred and why existing controls failed to prevent or detect it. Distinguish the immediate cause, contributing factors and underlying system cause. More than one cause may be defensible. Containment protects current batches; RCA supports longer-term prevention. The investigation depth should follow product risk, process complexity and uncertainty—not a fixed template.
A useful problem statement records what happened, where it occurred, when it began and how often it recurred. For example, an atypical chromatography peak should not automatically be attributed to an analyst.What Should an Investigation Establish?
Define the event, affected lots, time window, product impact and applicable requirements. Test each explanation against contemporaneous records, interviews, sampling history and scientific plausibility. Specify the evidence that would falsify a hypothesis. Where a single true cause cannot be established, document the most likely causes, uncertainty and controls; do not present speculation as fact.
Root Cause Analysis in Pharma: 4 Critical Evidence Streams to Verify
| Evidence stream | Verification question | Typical record |
|---|---|---|
|
Batch execution |
When did variability begin? |
BMR, IPC, yield trends |
|
Laboratory |
Is the result scientifically valid? |
Raw data, system suitability |
|
Equipment |
Was the system capable? |
Alarm, calibration, maintenance |
|
People/process |
Were instructions feasible? |
Training, SOP, shift handover |
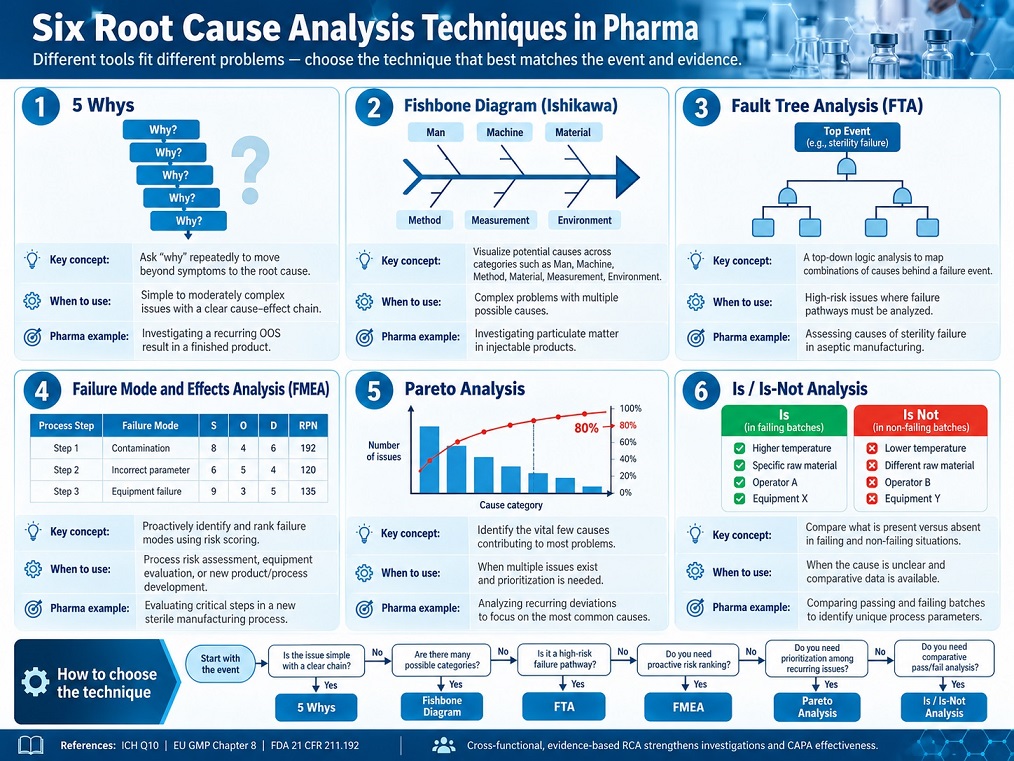
Six Root Cause Analysis Methods Used in Pharma
Select the RCA method that best fits the deviation. Each technique provides a different perspective on potential causes. Combining multiple methods often leads to stronger and more reliable investigations.
Number One: 5 Whys
Number Two: Fishbone (Ishikawa)
Number Three: Fault Tree Analysis (FTA)
Number Four: Failure Mode and Effects Analysis (FMEA)
Number Five: Pareto Analysis
Number Six: Is / Is Not Analysis
Number One: 5 Whys
Start with the observed deviation and ask why each preceding condition existed. Check every answer against records; a five-question sequence is not mandatory.
- Use batch timestamps
- Verify procedural constraints
Number Two: Fishbone (Ishikawa)
Group candidate causes under personnel, methods, machines, materials, measurement and environment. The diagram structures brainstorming; it does not establish causation without evidence.
Investigation output: documented hypotheses, exclusions and supporting evidence for QA review.
Number Three: Fault Tree Analysis (FTA)
Define the top event and map necessary combinations of failures using AND/OR logic. FTA is useful for complex aseptic, equipment or utility events with interacting safeguards.
- Define top event
- Check barrier failures
Number Four: Failure Mode and Effects Analysis (FMEA)
Score severity, occurrence and detectability using site-approved criteria, then prioritize investigation or mitigation. Risk priority numbers are screening aids, not proof of a root cause.
Investigation output: documented hypotheses, exclusions and supporting evidence for QA review.
Number Five: Pareto Analysis
Stratify repeated deviations by failure mode, line, shift or product. Rank their frequency or impact to select deeper investigations; the largest category is not automatically causal.
- Normalize event rates
- Check data completeness
Number Six: Is / Is Not Analysis
Compare when and where the event occurs with similar conditions where it does not. Differences in material lot, equipment, operators or timing can expose testable hypotheses.
Investigation output: documented hypotheses, exclusions and supporting evidence for QA review.
Tool selection should reflect the failure pathway. Use a fishbone diagram to explore broad categories, Is / Is Not to isolate meaningful contrasts and FTA for interacting protective barriers. FMEA is most useful when prioritizing prospective risks or comparing failure modes; it should not be mistaken for direct causal proof. Investigators should preserve contradictory findings rather than forcing all evidence into the first plausible theory.
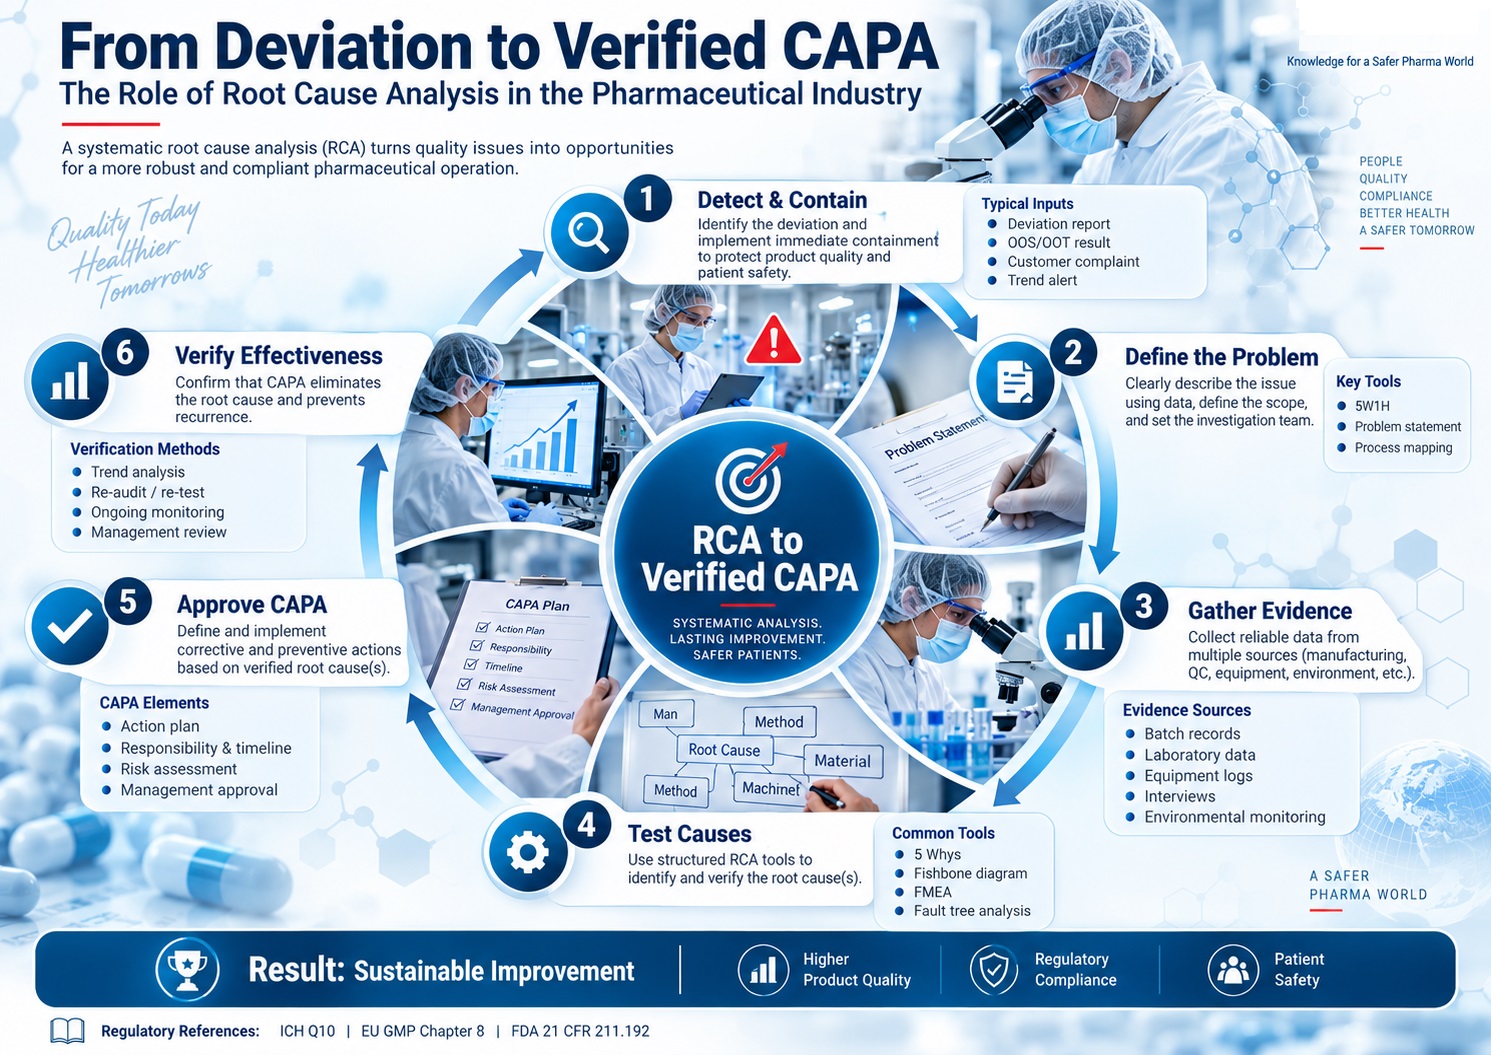
How to Run a Defensible GMP Deviation Investigation
Begin with immediate product and process containment, then set a clear problem statement. Map the event chronology, identify comparable batches and preserve original electronic and paper records. Form a cross-functional team spanning production, QC, engineering and QA. Prioritize scientific testing over assumptions, evaluate potentially affected products and obtain independent quality-unit decisions before final disposition.
GMP Deviation Investigation Key Steps
| Stage | Required output | Review gate |
|---|---|---|
|
1. Scope |
Affected lots and boundaries |
Patient/product risk |
|
2. Evidence |
Chronology and raw records |
Data integrity |
|
3. Hypotheses |
Verified or excluded causes |
Scientific rationale |
|
4. CAPA |
Owners, due dates, controls |
Risk-based approval |
|
5. Effectiveness |
Predefined outcome measures |
QA conclusion |
The investigation file should make decision chronology visible: who assessed initial risk, who approved containment, when the scope changed and which data supported lot disposition. If additional materials or products share equipment, personnel, analytical methods or manufacturing steps, justify their inclusion or exclusion. QA approval must be independent, and any continuing uncertainty should be reflected in the documented product-risk assessment.
Root Cause Analysis Example: Repeated Tablet Dissolution Failure
Consider a fictional site where three of twelve reviewed commercial batches show atypical dissolution trends. The ratio, 25%, is an illustrative case calculation, not an industry benchmark. Investigators compare raw dissolution profiles, granulation moisture, compression force, lubricant mixing time and instrument suitability. A 5 Whys exercise suggests excessive lubricant blending, while an Is / Is Not comparison reveals the issue only on one mixer after a recipe change.
From Hypothesis to Verified Cause
Controlled engineering trials and historical trend review support a mixing-time mechanism, subject to protocol approval and evaluation of confounders. The team updates recipe controls and alarm limits, qualifies affected operators and evaluates any impacted batches. A training-only CAPA would be inadequate if the system still permits an incorrect mixing duration.
How Should CAPA Effectiveness Be Measured?
Set outcome measures before implementation: recurrence rate per eligible batch, dissolution trend stability, recipe deviations and alarm response compliance. Compare a justified monitoring period with a pre-CAPA baseline. A 30/60/90-day review can be an internal practice but is not a universal regulatory requirement. Reopen the investigation when the predefined acceptance criteria are not met.
CAPA Effectiveness Check Methods
| Metric | Formula or check | Interpretation |
|---|---|---|
|
Repeat deviation rate |
Repeat events / eligible batches × 100 |
Use like-for-like exposure |
|
CAPA on-time completion |
Completed by due date / due × 100 |
Schedule metric, not proof |
|
Process stability |
Trend against validated limits |
Detect drift and recurrence |
|
Practical Competency |
Successful observations ÷ total observations |
Measure actual task performance |
|
Evidence integrity |
Traceable original-data review |
Supports conclusion |
Common RCA Mistakes Inspectors Challenge
Weak investigations stop at “operator error,” rely on untested fishbone diagrams, omit earlier similar deviations or close CAPA on training attendance alone. EU GMP Chapter 8 explicitly warns against overlooking system-based causes when human error is proposed. FDA 21 CFR 211.192 requires investigations to extend, where appropriate, to other potentially associated batches and products. Document unresolved uncertainty and justify both scope and risk decisions.
Final Word
Effective root cause analysis in pharma transforms deviations into demonstrable process learning. Select tools according to complexity, test causal claims against reliable GMP records and assess whether each action changes the failure mechanism. Successful CAPA combines appropriate product decisions, accountable owners, measurable effectiveness criteria and continued trend monitoring.
The strongest investigation is not the longest report; it is the one whose conclusions withstand technical challenge and help prevent recurrence.
FAQs
GMP regulations require thorough investigations of quality deviations and unexplained discrepancies. FDA 21 CFR 211.192, ICH Q10, and EU GMP Chapter 8 establish expectations for scientifically justified investigations, identification of underlying causes, and effective corrective and preventive actions. No single RCA technique is universally mandated.
Six widely used RCA methods include 5 Whys, Fishbone (Ishikawa) Diagram, Fault Tree Analysis (FTA), Failure Mode and Effects Analysis (FMEA), Pareto Analysis, and Is / Is Not Analysis. Each technique serves a different purpose, from exploring potential causes to evaluating complex failure pathways and prioritizing risks.
The selection depends on investigation complexity, available evidence, potential patient risk, and the failure mechanism. The 5 Whys method suits straightforward causal chains, Fishbone diagrams help explore multiple hypotheses, and Fault Tree Analysis evaluates interacting failure pathways. Combining methods often strengthens investigation conclusions.

Ershad Moradi
Ershad Moradi, a Content Marketing Specialist at Zamann Pharma Support, brings 6 years of experience in the pharmaceutical industry. Specializing in pharmaceutical and medical technologies, Ershad is currently focused on expanding his knowledge in marketing and improving communication in the field. Outside of work, Ershad enjoys reading and attending industry related networks to stay up-to-date on the latest advancements. With a passion for continuous learning and growth, Ershad is always looking for new opportunities to enhance his skills and contribute to pharmaceutical industry. Connect with Ershad on Facebook for more information.

Root Cause Analysis in Pharmaceutical Industry: 6 Powerful Methods in 2026
Explore 6 powerful root cause analysis methods in pharma to investigate deviations, strengthen CAPA, ensure GMP compliance, and protect patient safety.

Quality Culture in Pharma Industry 2026: Proven Ways to Build Trust
Explore how to build a strong quality culture in the pharmaceutical industry in 2026 through leadership commitment, ICH Q10 principles, meaningful GMP metrics, effective CAPA, and continuous improvement.

GMP Training Effectiveness 2026: Proven Ways to Build Real Competence
GMP training effectiveness goes beyond attendance records and quiz scores. Learn how role-based assessments, on-the-job observation, and meaningful KPIs help verify employee competence, strengthen training records, and address recurring performance gaps across pharmaceutical operations.