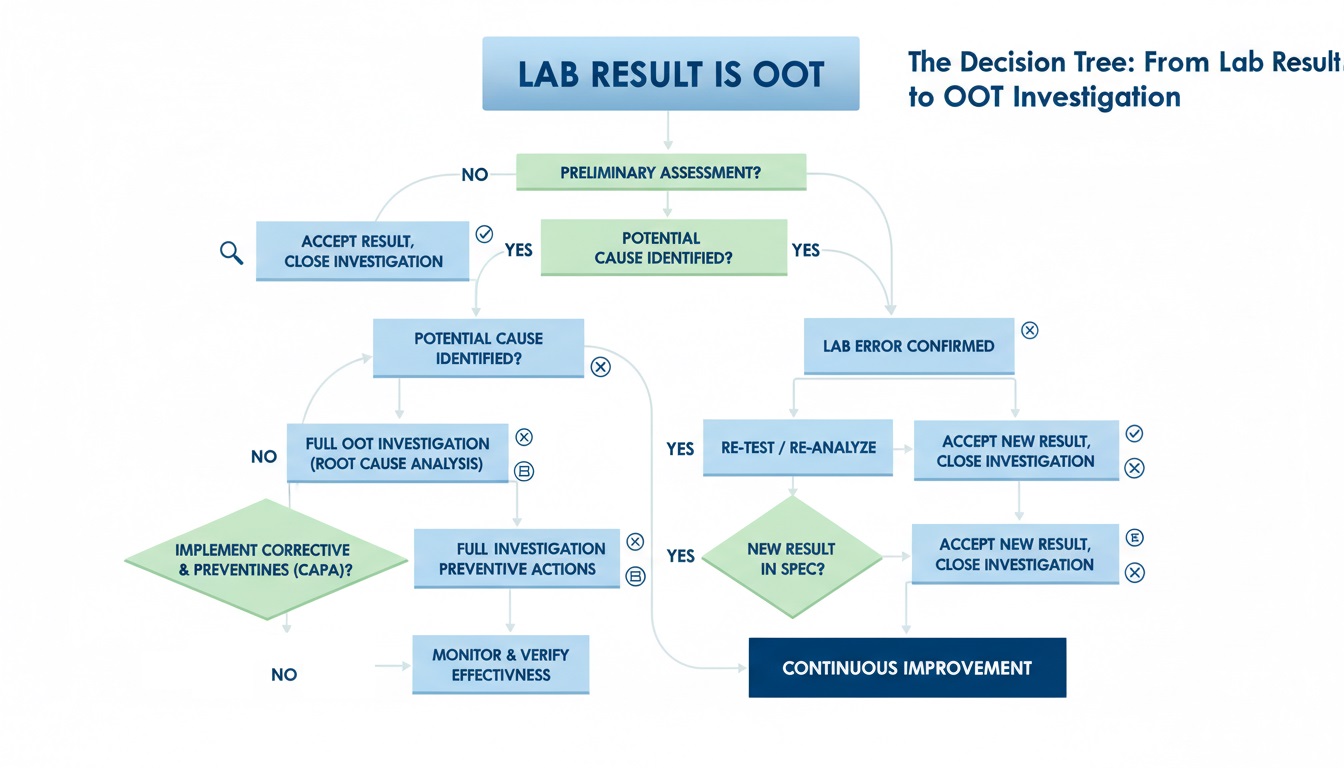
Out of Trend (OOT) Masterclass 2026: Essential Strategies for Bulletproof Pharma Compliance

Out of Trend (OOT) results signal data trends that deviate from expected norms, often serving as early warnings in pharmaceutical manufacturing. According to WHO, failure to detect and investigate OOT findings can lead to costly Out of Specification (OOS) failures, which account for nearly 20% of batch rejection causes globally. Ignoring OOT trends jeopardizes product quality and regulatory compliance, increasing risks of recalls and production delays.

Implementing strong Good Manufacturing Practices (GMP) is essential to identify and manage OOT results promptly. GMP requires thorough investigation, documentation, and corrective actions to prevent OOS issues. By embedding GMP principles, manufacturers ensure product consistency, minimize risks, and maintain regulatory trust.

Table of Contents

What is Out of Trend (OOT)?

Out of Trend (OOT) means data shows unexpected changes over time. It highlights results that drift from usual patterns. Detecting OOT early helps prevent bigger problems later. You must review OOT data carefully to maintain quality. Understanding OOT saves time and reduces testing costs.


To manage OOT, follow these key technical guidelines: 

  • Monitor data regularly for unusual trends.
  • Investigate OOT results immediately.
  • Document all findings clearly.
  • Compare results with historical data.
  • Implement corrective actions quickly.

These steps ensure accurate analysis and maintain product quality.

OOT vs. OOS, and OOE

OOT, Out of Specification (OOS), and Out of Expectation (OOE) are different but related concepts in quality control. OOT refers to data showing unusual changes over time but still within specifications. OOS means a test result falls outside established specification limits, indicating a definite quality issue. OOE involves results that do not meet expected patterns or criteria, even if they are within specifications, signaling potential problems.

Understanding each term helps companies act correctly. For example, OOT detection can prevent OOS failures, while OOE highlights unexpected but acceptable variations. Proper investigation and corrective actions must follow to ensure product safety and compliance.

Comparative Matrix of OOS, OOT, and OOE Parameters

Parameter OOS (Out of Specification) OOT (Out of Trend) OOE (Out of Expectation)
Definition
Result outside specification limits
Data trends deviate over time
Results differ from expected patterns
Impact
Quality failure
Potential quality risk
Variation within specs but unusual
Example
Test result exceeds allowed limit
Gradual increase in impurity levels
Unexpected variation in batch data

OOT vs. Out of Specification (OOS)

OOT shows unusual data trends that stay within specification limits. In contrast, OOS means test results break these limits. Both require fast action but differ in urgency. First, recognize the difference clearly. Then, respond to protect product quality.


Here are technical guidelines for handling OOT vs. OOS: 

  • Monitor data continuously to spot trends.
  • Investigate immediately when OOS occurs.
  • Analyze trends carefully for OOT signals.
  • Document findings clearly and promptly.
  • Take corrective actions quickly to fix issues.

OOT vs. Out of Expectation (OOE)

OOT reveals unusual trends within limits, while OOE shows unexpected but acceptable results. Both highlight potential issues, so companies must investigate thoroughly. First, understand the differences to act properly. Then, evaluate data carefully to maintain quality standards.


Follow these technical guidelines for OOT and OOE: 

  • Track data trends to detect deviations early.
  • Review data patterns against expectations regularly.
  • Document all unusual findings in detail.
  • Communicate results to the quality team quickly.
  • Adjust processes to prevent future issues effectively.

Key Requirements for OOT

Key requirements for OOT include strong statistical methods to spot unusual trends early. Companies must perform root cause analysis (RCA) and corrective actions (CAPA) to fix problems. Additionally, an integrated stability monitoring program helps track product quality over time.


To meet OOT requirements, follow these steps: 

  • Use robust statistical methodology for clear trend detection.
  • Conduct RCA and CAPA to address root causes.
  • Implement an integrated stability monitoring program effectively.

Robust Statistical Methodology

Robust statistical methodology helps detect unusual trends and prevents quality issues early. It improves data accuracy and supports better decision-making. Therefore, companies must use strong statistical tools regularly to analyze results carefully.


Key actions include: 

  • Apply statistical tests to identify outliers quickly.
  • Utilize control charts for continuous monitoring.
  • Use trend analysis to spot changes early.
  • Train staff on proper statistical techniques consistently.

Root Cause Analysis (RCA) and CAPA

Root Cause Analysis (RCA) helps find the main cause of problems quickly. CAPA then fixes these issues to stop them from happening again. Together, they improve product quality and process reliability efficiently.

Important steps include: 

– Investigate problems thoroughly during RCA. 

– Implement corrective actions effectively with CAPA.

Integrated Stability Monitoring Program

An integrated stability monitoring program helps track medicine quality over time. It combines data from various tests to ensure consistent product safety. Therefore, companies avoid surprises and keep patients safe.


Key points include: 

– Collect stability data regularly from all product batches. 

– Analyze results together to detect trends quickly.

The Decision Tree From Lab Result to OOT Investigation

Statistical Methods & Calculation for Trend Detection

Statistical methods help detect trends in data and understand changes clearly. They use calculations to spot patterns that might indicate problems or improvements. Therefore, these methods support better decision-making in quality control and process management.


Important steps are: 

  • Use regression analysis to identify trends over time.
  • Calculate control limits to monitor data variation effectively.

Regression Analysis (The Slope Control Method)

Key methods in Regression Analysis (The Slope Control Method) include:


  • Calculate the slope of the data trend line.
  • Test if the slope is significantly different from zero.
  • Use linear regression to model the relationship between variables.
  • Monitor changes in the slope to detect shifts or trends.
  • Apply confidence intervals to assess the slope’s accuracy.

Control Charts (The Shewhart / 3-Sigma Method)

Control charts help monitor processes and detect variation quickly. The Shewhart method uses 3-sigma limits to decide if a process stays in control. Therefore, it helps identify unusual changes early and keep quality steady.


Key points are: 

  • Plot data regularly on the control chart.
  • Use 3-sigma limits as control boundaries.
  • Investigate points outside these limits immediately.
Anatomy of a Control Chart with 2-Sigma and 3-Sigma Flags

Regulatory Framework: FDA, USP, and EMA Guidelines

FDA, USP, and EMA provide clear guidelines to ensure product safety and quality. Also, they update rules regularly to improve standards and protect consumers.

Companies must follow these guidelines strictly to avoid legal issues and maintain trust.

– Understand each agency’s requirements well. 

– Implement quality controls consistently. 

– Train staff on regulatory standards. 

– Keep detailed and accurate records.

Final Word

Out of Trend (OOT) monitoring has become essential in today’s quality frameworks, especially with FDA guidelines emphasizing proactive quality control. According to the FDA’s Process Validation guidance (2011), companies should detect and investigate OOT results promptly to maintain process control. Studies show that incorporating OOT monitoring reduces batch failures by up to 30%, supporting the proactive shift toward Quality by Design (QbD). Consequently, OOT is no longer optional; it now serves as a critical pillar in ensuring consistent product quality and regulatory compliance.


Our policies reinforce this proactive approach by requiring real-time OOT detection and thorough investigation. We follow FDA’s recommendations and integrate OOT monitoring into all stages of production. This alignment with QbD principles improves product reliability and minimizes risk, ensuring stronger compliance and better customer outcomes.

FAQs

1️⃣ 1. What is the difference between Out of Trend (OOT) and Out of Specification (OOS)?

OOT refers to unusual data trends over time that remain within specification limits, while OOS indicates test results that fall outside the established specification limits, signaling a definite quality failure.

2️⃣ 2. Why is detecting OOT important in pharmaceutical manufacturing?

Early detection of OOT helps prevent more severe issues like OOS failures, reducing batch rejection rates, minimizing production delays, and ensuring product quality.

3️⃣ 4. Which regulatory guidelines address monitoring of OOT results?

Guidelines from FDA, USP, and EMA emphasize prompt detection and investigation of OOT data as part of Good Manufacturing Practices and process validation to maintain product quality and compliance.

Picture of Ershad Moradi

Ershad Moradi

Ershad Moradi, a Content Marketing Specialist at Zamann Pharma Support, brings 6 years of experience in the pharmaceutical industry. Specializing in pharmaceutical and medical technologies, Ershad is currently focused on expanding his knowledge in marketing and improving communication in the field. Outside of work, Ershad enjoys reading and attending industry related networks to stay up-to-date on the latest advancements. With a passion for continuous learning and growth, Ershad is always looking for new opportunities to enhance his skills and contribute to pharmaceutical industry. Connect with Ershad on Facebook for more information.

Sterile manufacturing compliance Los Angeles lab professionals reviewing validated production data under 21 CFR Part 210 and 211 compliance.

Pharma Jobs Los Angeles in 2026: GMP Compliance and Salary Trends

Los Angeles continues to expand across pharmaceutical companies in Los Angeles and biologics manufacturing Southern California. From GMP jobs in Los Angeles to pharmacist jobs Los Angeles CA, hiring demand reflects strong regulatory oversight and advanced clinical research growth in LA – California.

Read More »
Pharma Factory and GMP Complance

Master ICH Q7 Guideline in 2026: Essential API GMP Rules You Must Know

ICH Q7 is the GMP guide for active pharmaceutical ingredients (APIs). It sets detailed standards for quality, documentation, validation, and supplier control. WHO reports that poor supplier management causes up to 30% of API quality issues. Following ICH Q7 ensures consistent product safety and regulatory compliance worldwide.

Read More »

Share